Maximise business opportunities with accurate demographic data
Our powerful demographic data solutions combine GIS mapping and drive time indices to deliver valuable insights that can be turned into decisive actions
Maximise business opportunities with accurate GIS mapping demographic data
Our powerful demographic data solutions combine GIS mapping and drive time indices to deliver valuable insights that can be turned into decisive actions
Understand socio-demographic trends on a national scale
Demographic data* shows the distinctive attributes of a population in a defined location, whilst GIS mapping connects this data with maps to help you understand today’s diverse and dynamic communities.
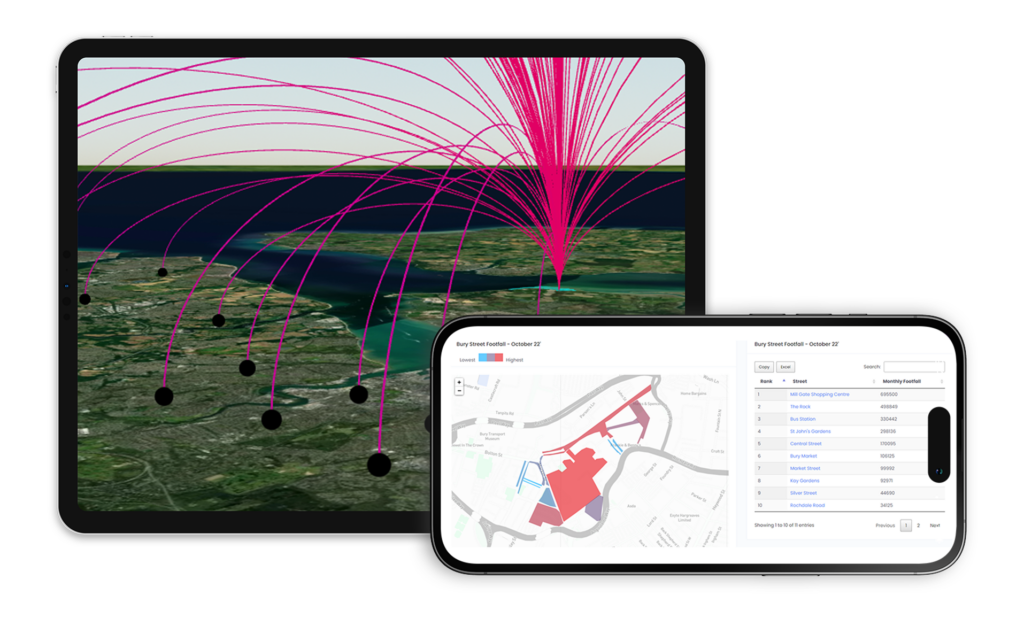
Isochrone Maps
Find out where people come from and their estimated drive, cycle or walk distance in an isochrone map
Affluence
Our demographic data reveals how affluent or socially deprived every postcode area is estimated to be
Working Households
Discover the number of working households and ownership status
Disposable Income
Dive deep into the buying behaviour of individuals within a specific postcode and their most likely purchases using disposable income
Socio-Demographics
Know the socio-demographic make-up of local populations to guide profitable business decisions
National Average**
Compare demographic data against the UK national average to discover key trends
Understand you customer with actionable insights
Demographic data shows the characteristics of the population in a set location, whilst GIS mapping connects the data to a map which is invaluable for assessing the specific area
Our secure data platform provides a wealth of insights, allowing you to understand visitor numbers and trends with precision for better decision making
No hardware required on location
One click report exports
Footfall data available from 2019
Unlimited user licenses
Daily, weekly and monthly data available
Compare against unlimited locations
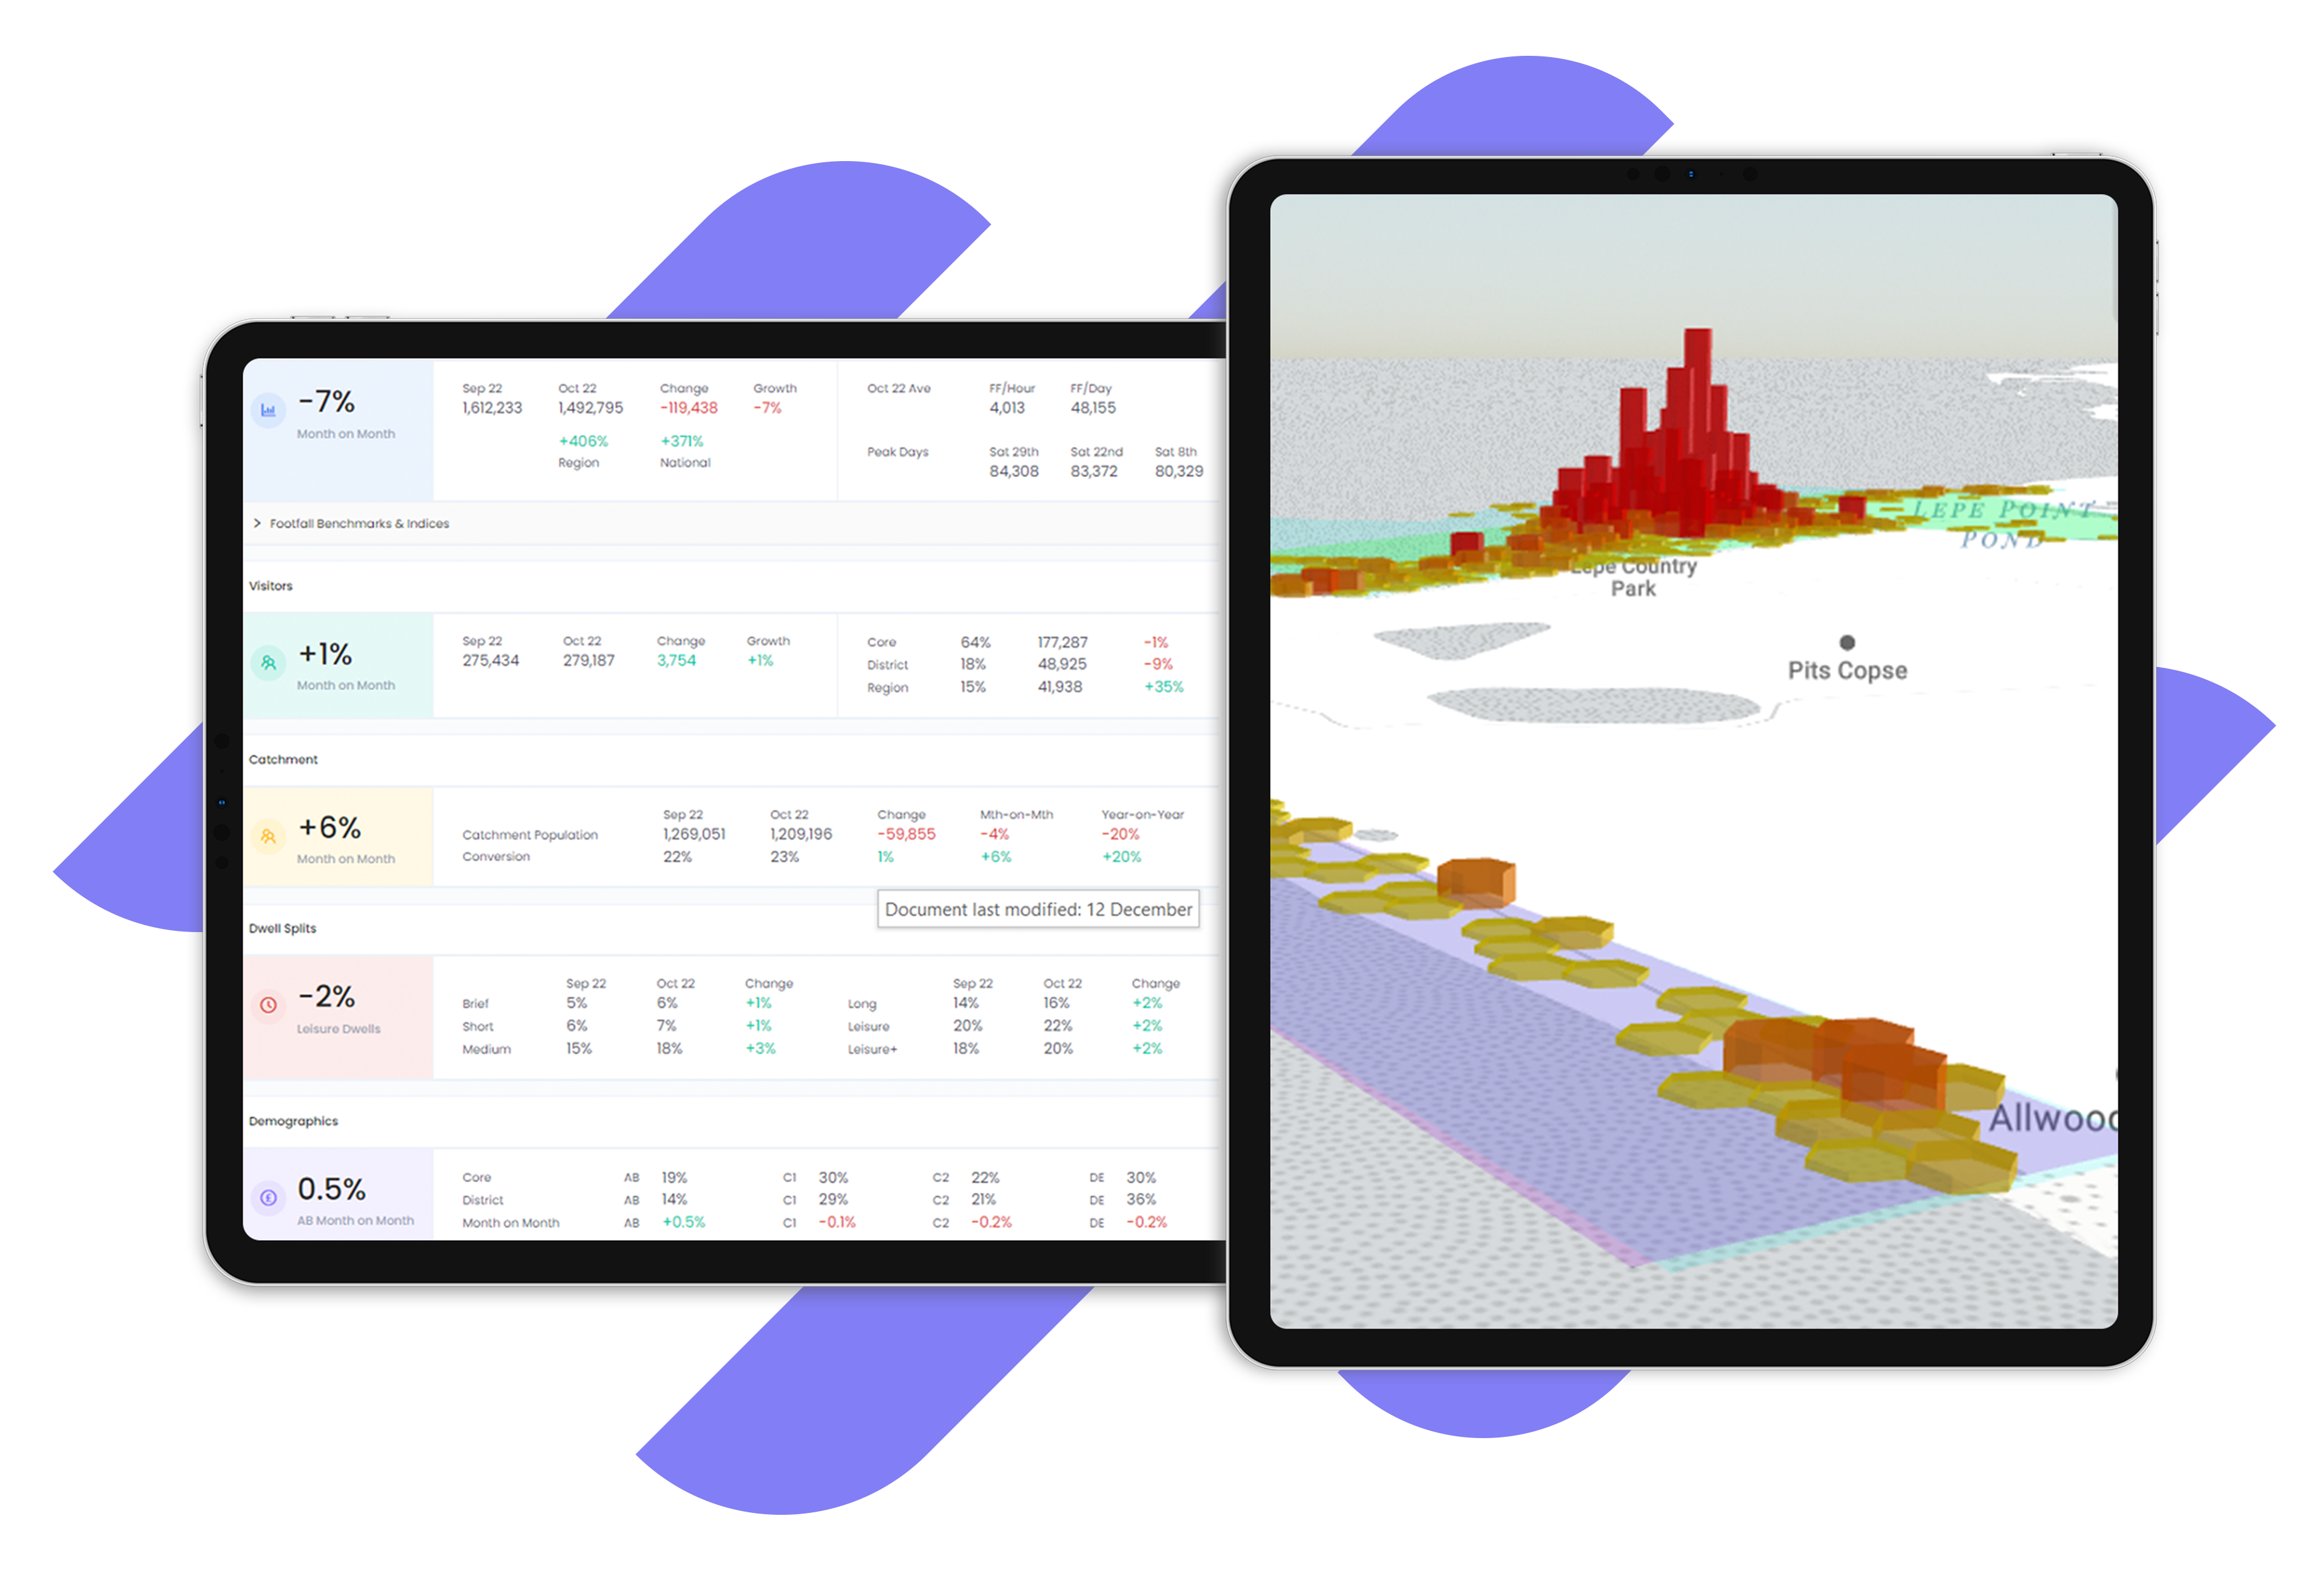
Our demographics dashboard
Drive Times Indices***
See which locations are accessible via driving, cycling or walking modes of transport within a 30, 20 and 10 minute time frame
Age Group Assessment
Find out the age distribution of a location and see how it compares to the national average
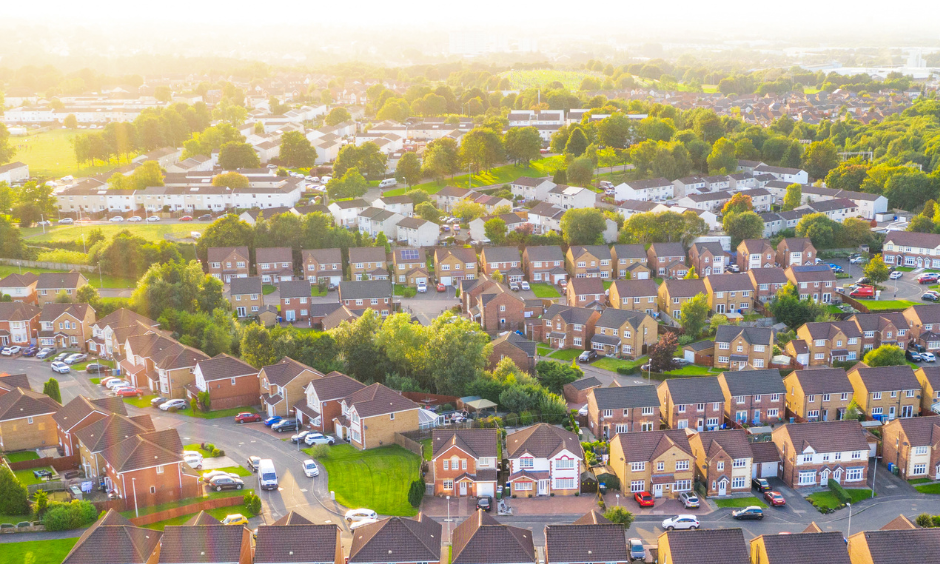
Dwelling Type
Understand the diverse types of dwellings within a certain postcode region, from detached, semi-detached and terraced to flats/apartments and caravans
Spending Habits
Examine a population’s spending habits on comparison goods, convenience goods, food and beverage, grocery and leisure
Education
Assess the levels of education in any given location for an indication of attainment within communities.
Household Vehicles
Understand the proportions of households with a varying number of vehicles – from 0 to 4 or more.
*Demographic data refers to statistical socio-economic information of a population such as gender, race, income, education and employment.
**When compared to the National Average, this highlights the unique attributes of your location and serves as an insightful benchmark for more meaningful observations.
***Drive time indices calculate the duration of a journey via three modes of transport: driving, cycling and walking, from a specific location within an estimated 10, 20 and 30 minute radius. The travelling distance takes into account access to motorways and dual carriageways, or conversely, the absence of high speed roads.
The demographic data is gathered from the last two Government censuses, conducted by the Office for National Statistics (ONS) in 2021 and 2011. The latest census information is not yet available and will be published in phases from 2022-2024.
Have questions about our insights and data?
Please share your contact details and we will happily share how Place Informatics can help you or call 0161 706 1343
Events
Immediate access to event visitor behaviour analytics in town centres, green spaces and venues across the UK