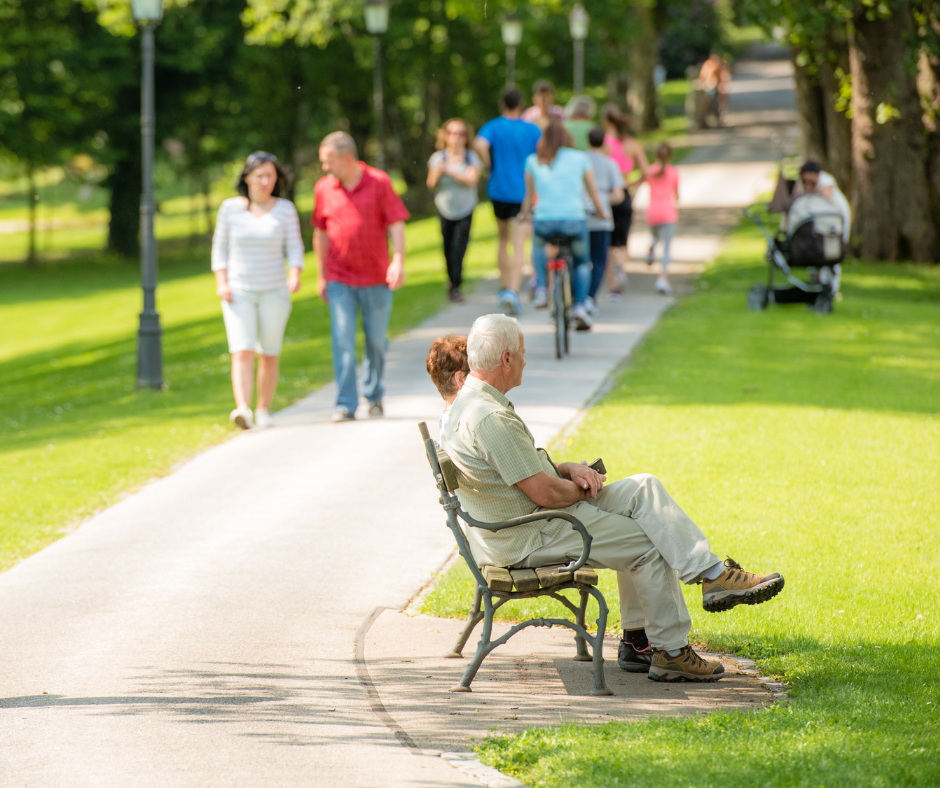
Both urban and rural green spaces are important for providing vital habitats for wildlife, offering mental and physical health benefits to people, and helping local communities to thrive. For local councils, park managers, AONB and heritage site custodians staff, it has become essential to use technology to understand the behaviour of visitors in order to optimise green spaces to use them to their fullest potential, as well as achieve environmental and financial KPIs.
Fortunately, there are technologically advanced ways to collect information about how people engage with Points of Interest (POIs) in the real world, such as footfall data. Let’s dive in further to find out how you can use footfall data to predict visitors’ needs in green spaces.
Who visits your green space?
It is important that you first understand the types of people visiting your green space. This can be done by analysing socio-demographic data from the Place Informatics dashboard such as age, gender, spending habits, disposable income. The population of each postcode is effectively assessed to find out the dominant characteristics, which is extremely useful to make decisions about your visitors needs.
Understand your target market
Knowing the demographic of your target market will help you tailor experiences that will meet the needs of those who live nearby and further afield. For example, if a large percentage of local visitors are families with young children, then you may want to focus on creating activities specifically aimed at this group such as installing a playground and if a high percentage of people over 60 visit during weekdays, you may decide to organise fitness activities aimed at this category.
Identify Hotspots & Access Points
Other ways footfall data can be used to predict visitors’ needs in green spaces is to map out hotspots within a given area—that is, locations where more visitors tend to congregate during their visits. Do visitors use the car parks or arrive by public transport? Which entrances and exits are the most popular? Which footpaths and routes around the green space are the busiest or underused?
Identifying the hotspots will help to guide decisions on signposting, installing seating, hosting events and providing guidance for commercial agreements with local traders, tourist centres, cafes etc. Additionally, it reveals which services should be expanded or improved upon. For instance, if an activity such as bird watching around a bird hide shelter is proving particularly popular, then providing free binoculars at certain points along the trail could further enhance visitor experience!
Using isochrone maps to identify new visitors
Finding out the potential walking, cycling, driving distances of your green space visitors in an isochrone map will help inform decisions on which postcode areas to target to scope out new visitors.
Measure Occupancy Levels & Dwell Time to Optimise Marketing
Once you have identified who your target market is and where they tend to access green spaces from, local authorities can start optimising their marketing efforts accordingly in order to increase occupancy levels of more areas in the green space in addition to dwell time (how long people spend at a particular location).
This could involve creating campaigns targeting local neighbourhoods based on their socio-demographic profile and offering discounts on souvenirs or food and drink outlets within the green space during off peak times in order to encourage more people to visit and to provide more of their needs and wants.
Investment Opportunities For Maintenance & Conservation Work
By using footfall data to predict visitors’ needs, managers can discover investment opportunities, plan maintenance, resourcing and conservation work in their green spaces.
By pinpointing locations which see heavier foot traffic, you can allocate resources effectively to ensure those areas receive the attention they deserve in relation to customer service, guides around the site and waste disposal.
The visitor footfall volumes, particularly from less affluent areas, can attract funding for regeneration projects in order for the space to remain safe and accessible, while preserving its natural beauty or heritage characteristics.
Get Instant Access to Green Space Data
Next time you’re looking for ways to predict visitors’ needs in your green space and ensure the best possible experience for your visitors, consider utilising footfall monitoring data – It could make all the difference!
Call 0161 706 1343 or book a webinar to see the data available for your green space in Calendly here: