The retail and leisure industry are highly competitive and these days many physical outlets and shopping parks utilise data and technologies powered by Artificial Intelligence to gain valuable insights on who their customers are and how they interact with their stores or leisure venues. One effective way to do this is by using heatmap data sets.
What are heatmaps?
Heatmaps are a visual representation of how footfall is distributed across a location such as a retail and leisure site. Generally, they measure the density of visitors through the use of colour at varying levels of intensity. For example, red and orange signify areas with the highest volume of foot traffic, whereas blue and green denote the lowest.
Traditionally, this data has been collected via hardware like sensors or CCTV cameras, but this is known to be a very expensive, restrictive and time-consuming method. Today, retailers and site managers can take advantage of billions of GDPR compliant mobility data points to accurately track people’s movements across a location over a variety of time periods.
Place Informatics RetailSites.AI dashboard shows heatmaps to discover where people are most likely to go, and where they could be encouraged to go, to help make better informed decisions about their sites, stores and venues.
The benefits of heatmaps for retail and leisure sites
Here are some of the key benefits of using heatmap data sets on retail and leisure sites:
– Improve customer experience: By understanding how customers move around the site and their location habits, you can improve the overall customer experience. For example, if you notice people are having difficulty finding a particular store, add new signage to make it easier for them to find what they’re looking for.
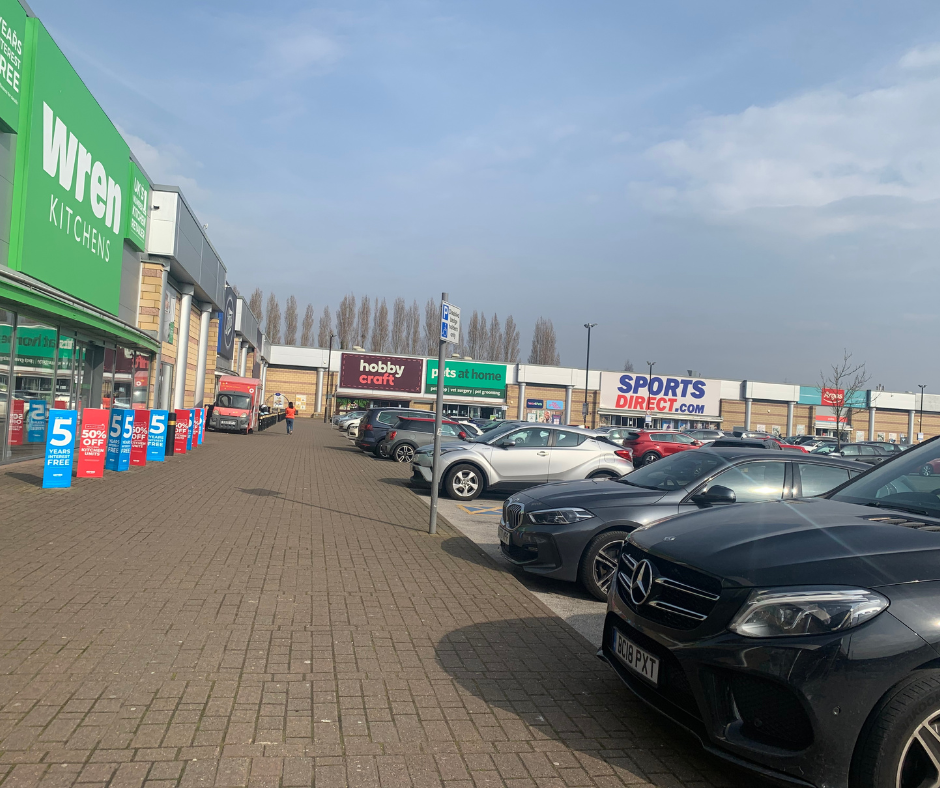
– Optimise retail site operations: Our retail heatmap data can pinpoint popular travel routes around your retail or leisure site location and car park, as well as showing any bottlenecks or dead zones that might be leading to a loss in visitor numbers. Thus, it enables you to coordinate customer traffic flow efficiently and determine the right places to bring in new offerings such as fast food outlets, to set up new displays or promotional offers to increase dwell time.
– Analyse retail site and leisure park performance: Heatmaps can also be used to compare the performance of local competitors. This information is especially useful if you are thinking about opening a new store, or evaluating how successful your targeted marketing campaign has been in terms of driving traffic into a location over time.
– Better inventory and staffing management: With retail heatmap data you can understand the busiest and quietest times of the day, week, month, and year to make better decisions about inventory management and staffing levels. The analysis will help you develop better inventory practices and respond to customer demand by allocating resources and staff appropriately.
Learn to use heatmap analytics from Place Informatics
Overall, data from heatmaps and the Place Informatics dashboard can revolutionise the way you run a retail site or leisure park, offering guidance on what areas need improvement in order to realise missed sales opportunities, increase outdoor foot traffic and make informed decisions for more positive outcomes.
Contact us on 0161 706 1343, or book a webinar of the data available specifically for your site location in Calendly here: https://calendly.com/clive-hall/diary-booking